
Your spreadsheets, automated.
Arkx is a spreadsheet-native data platform for analysts in SMBs. Pipe data from anywhere, transform it visibly, and publish a single source of truth.
Extract
Connections or AI extraction
Clean
ETL like Power Query
Analyse
In a spreadsheet
Publish Data
Live to your database in Arkx
AI agents across every step. Describe what you need and let a AI agent build it for you
Analyst Teams are doing digital manual labor.
Your workflow is broken. It's stitched together with CSV extractions, copy pasted tables, master files and manually refreshing data tables.
Locked in SharePoint or DropBox
Teams live in SharePoint or DropBox. These systems are built for file storage, not data pipelines, making them hard to move data in to and out of.

Master files become monster files
The whole pipeline runs inside one spreadsheet. Sources, logic, and outputs is entangled and 1 edit silently introduce 3 new errors.
Agents can't see outside your Excel file
AI agents lives only inside the spreadsheet they see and can't preform actions beyond editing cells.
The Source of truth has become a puzzle
The same data ends up in five files, and every copy quietly drift from the last. When they misalign, there's no way to tell which one is true.
Four steps. One spreadsheet-native pipeline.
Pull data from anywhere
Connections or AI extraction from any unstructured file. It lands a clean table in the database, ready for next step.
Connections
Pick a source to pull data
Transformations everyone can see and trust.
Transformations happen in a shared, visible ETL flow and not locked inside one analyst's workbook. Every filter, merge, and pivot is traceable and the final table lands as a table in the database so you can easily see and compare the data from before.
Applied steps
Spreadsheets for analyzing.
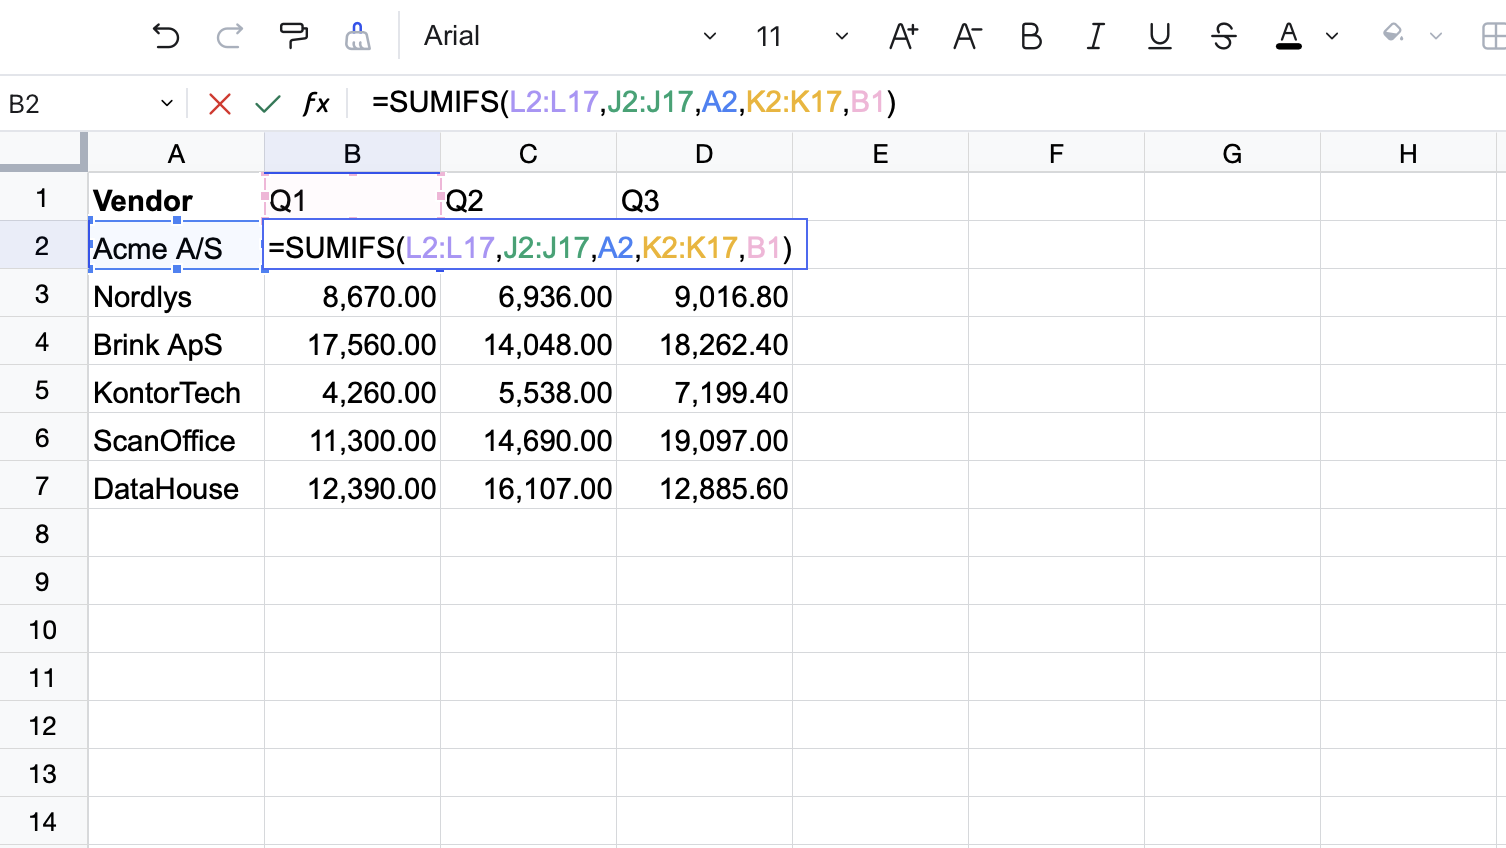
Work in the spreadsheet you already think in. Your formulas, your models, but on top of live and approved data directly pulled from the source. No hardcoded tables, no retyped numbers. You save only the important and final tables in the database.
One governed table for every BI tool.
Push your output to a governed table in Arkx. Any BI tools, excel files or scripts queries the same live source. One version of the truth, always current.
Data Hub
A team based in Copenhagen, Denmark.
Proudly built in Copenhagen, Arkx is designed for teams that run on spreadsheets. Our mission is simple to let analysts focus on what actually matters—analysis, judgment, and insight. We're building a data integrity layer that gives you the power of a modern data platform, without forcing you to abandon the tools you already know.
Join the waitlist.
Get notified at launch and receive discounts on our platform.
- No spam. We will reach out to you when we launch.
- No commitment of course. You can always leave the list.
- Discount on our platform for the people on our waiting list.